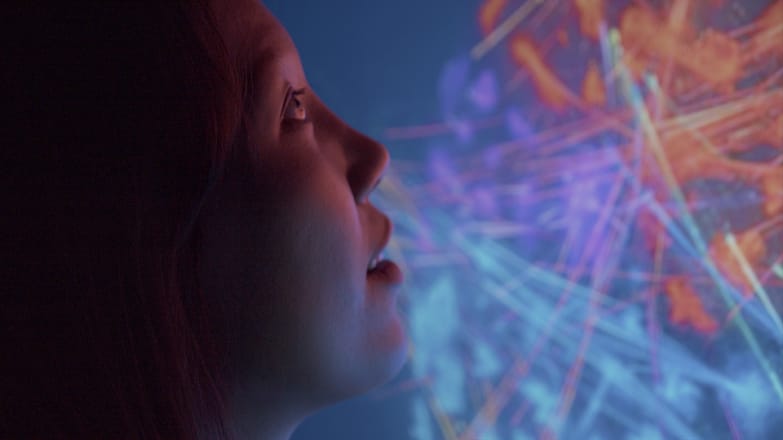
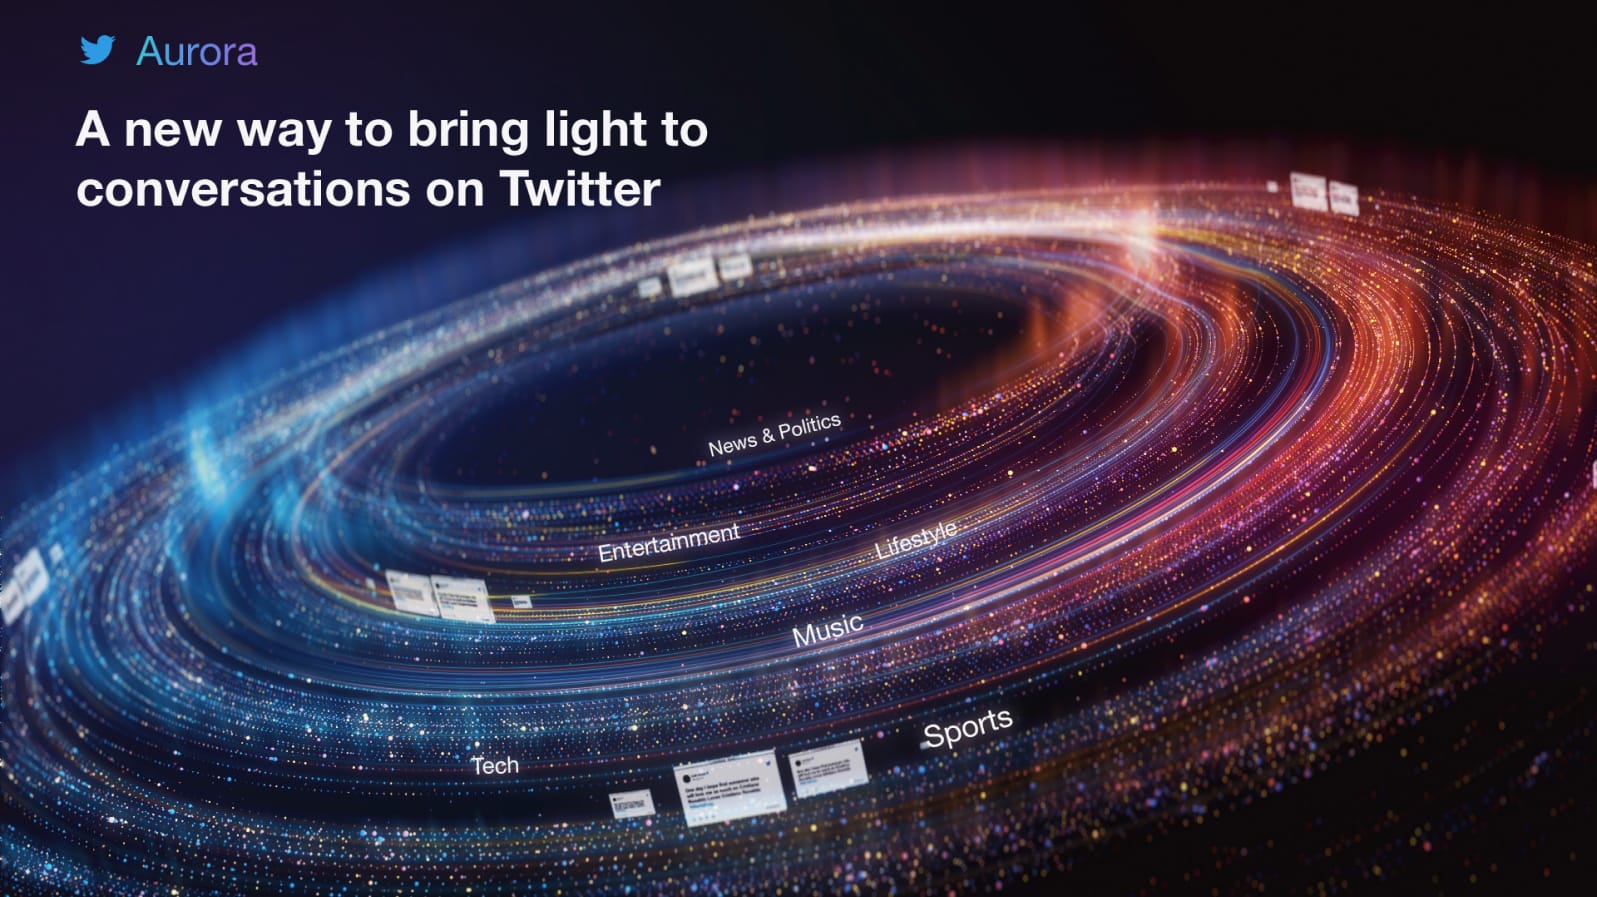
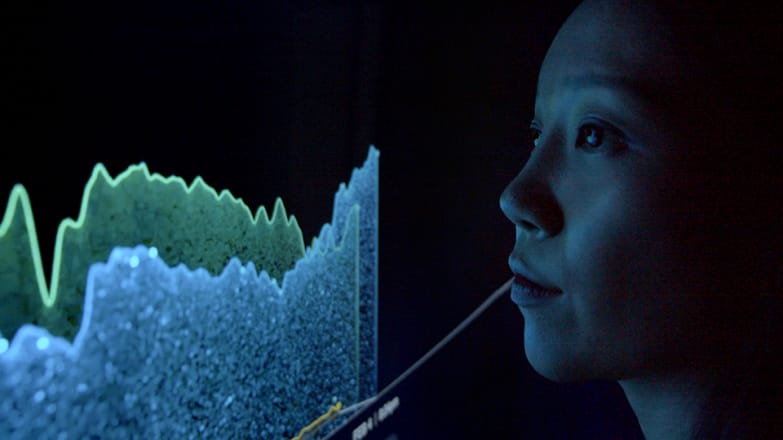
Aurora is a powerful data visualizer that surfaces the communities and conversations happening on the Twitter platform in realtime.
The interactive tool helps Twitter better understand users’ habits, patterns, and insights through unique data modules such as geolocation, interest maps, propagation, and trends over time.
Client & Partner: Twitter
From branding, to experience architecture, to prototyping, Rare Volume partnered with internal Twitter teams and stakeholders to design and develop the Aurora experience over a span of 2 years.
Twitter Aurora was developed and housed at Twitter’s headquarters in NYC and San Francisco, while Story Mode exports of current events and trends are displayed in offices around the world.
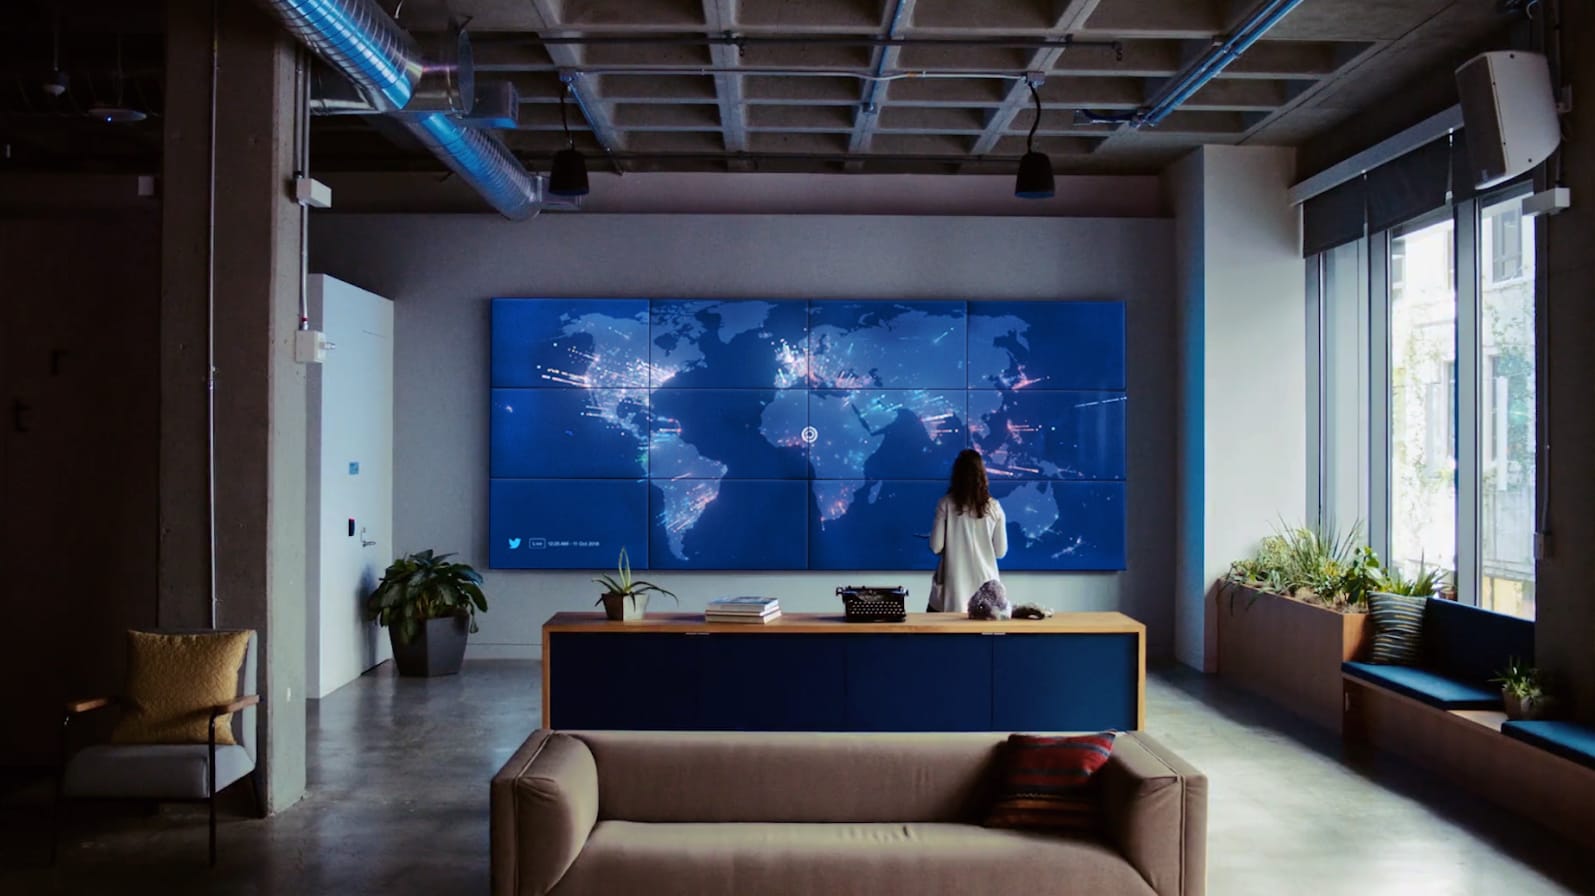


Twitter Aurora is fundamentally a live map of Twitter. It presents—in both macro and micro views—conversations on the platform, and provides new ways to discover insights and trends among a wide range of communities. It visualizes Twitter from a new perspective—reshaping a complex data system into more human, relatable narratives.
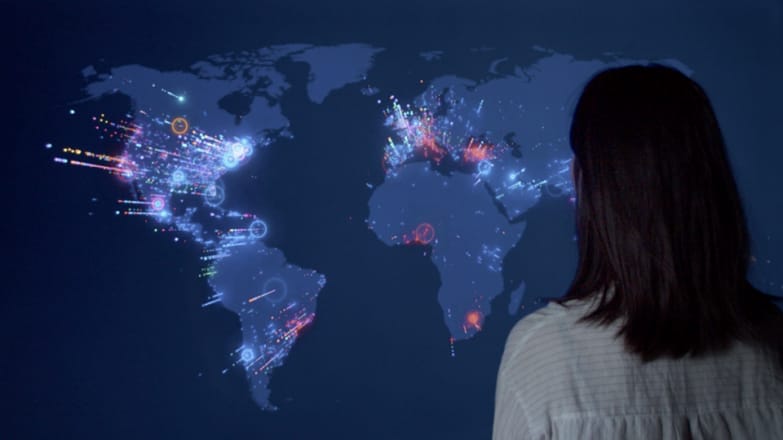
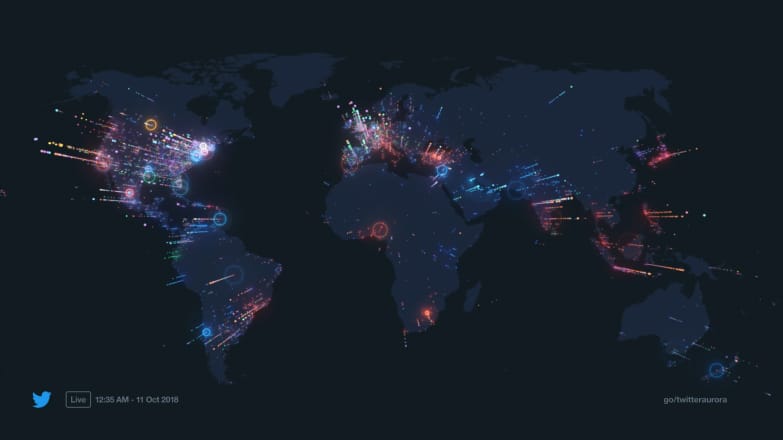
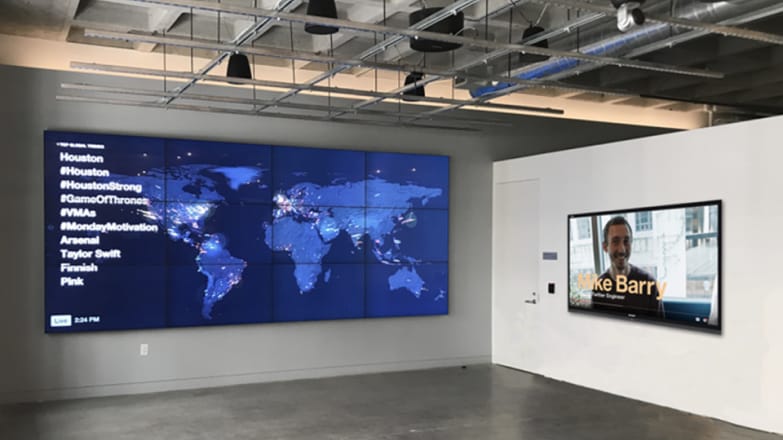
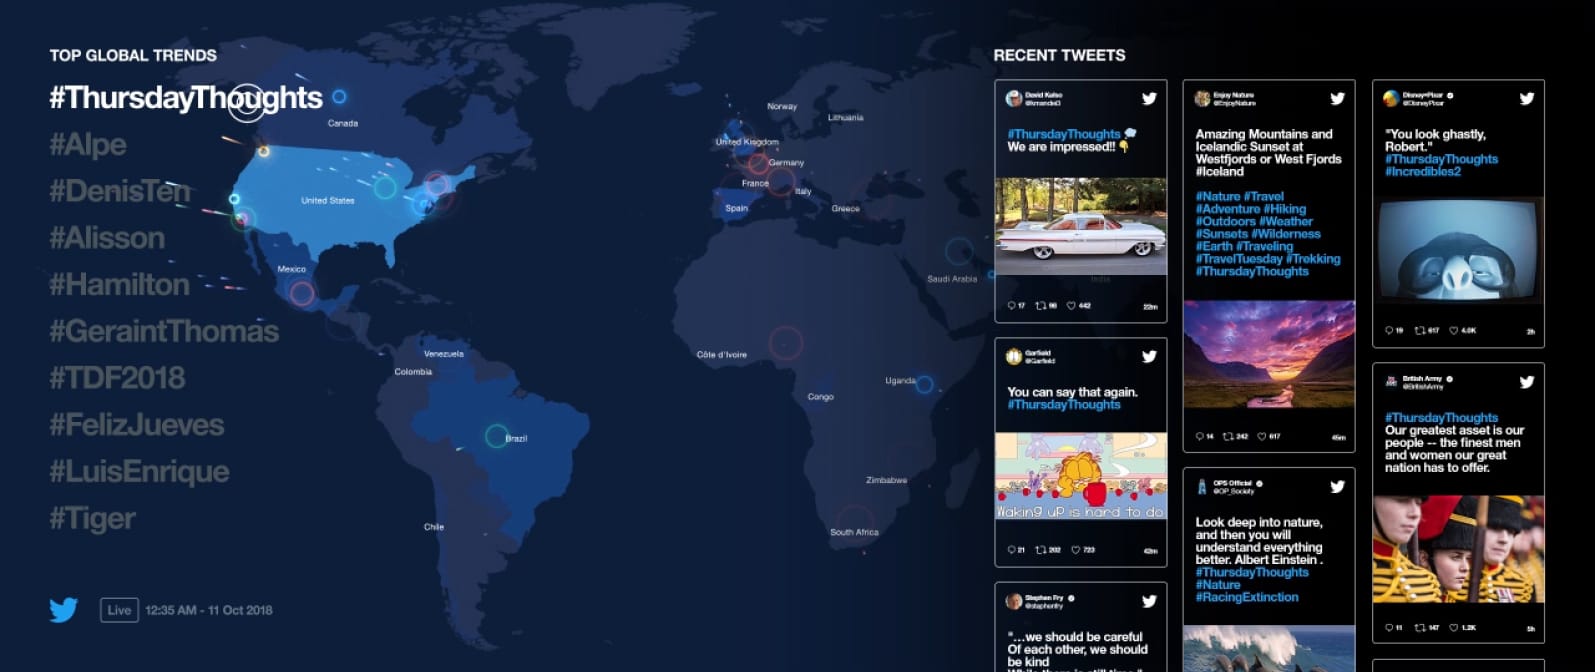
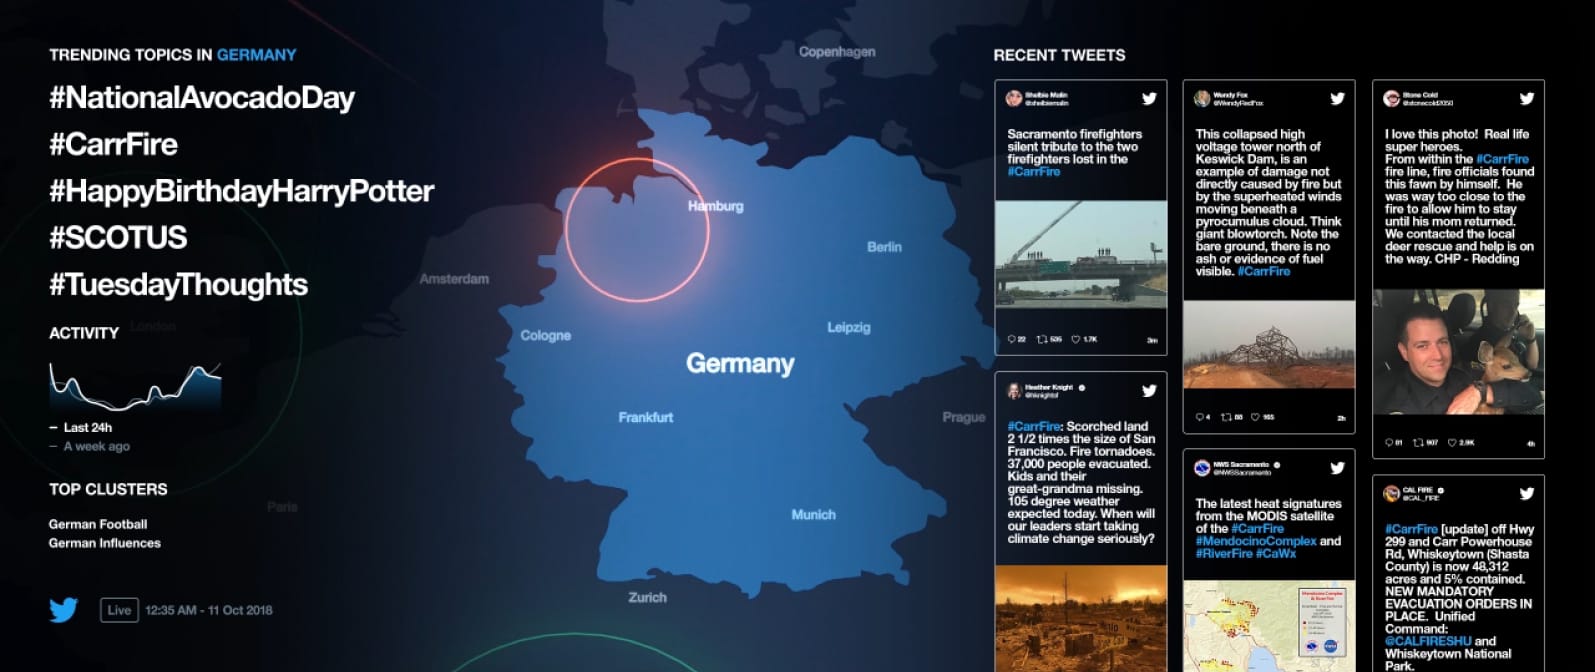
Geo Mode
Geo Mode maps Twitter activity over a representation of our world. Tweets, retweets, and comments animate across the map as discussions evolve in realtime. Navigate over trending topics, or zoom into specific countries to understand common threads and unique phenomena from both macro and micro states.
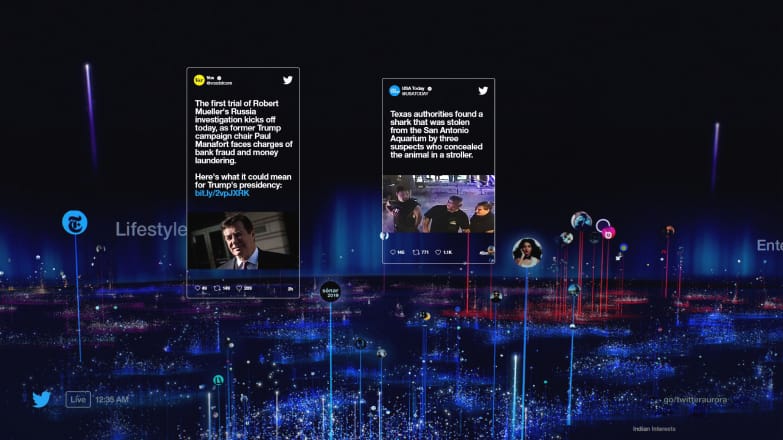
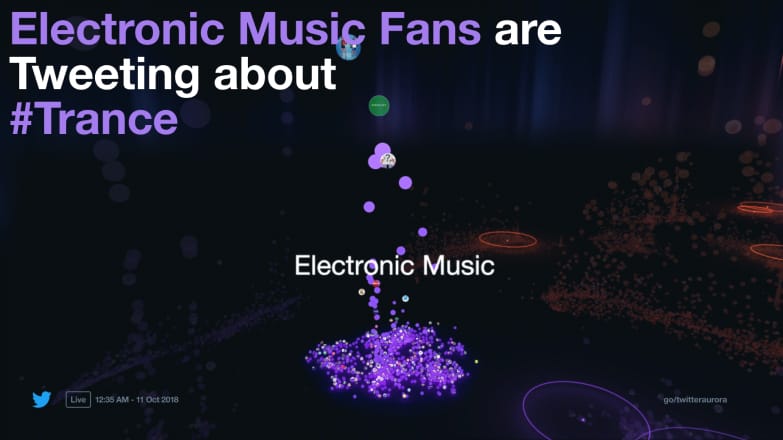
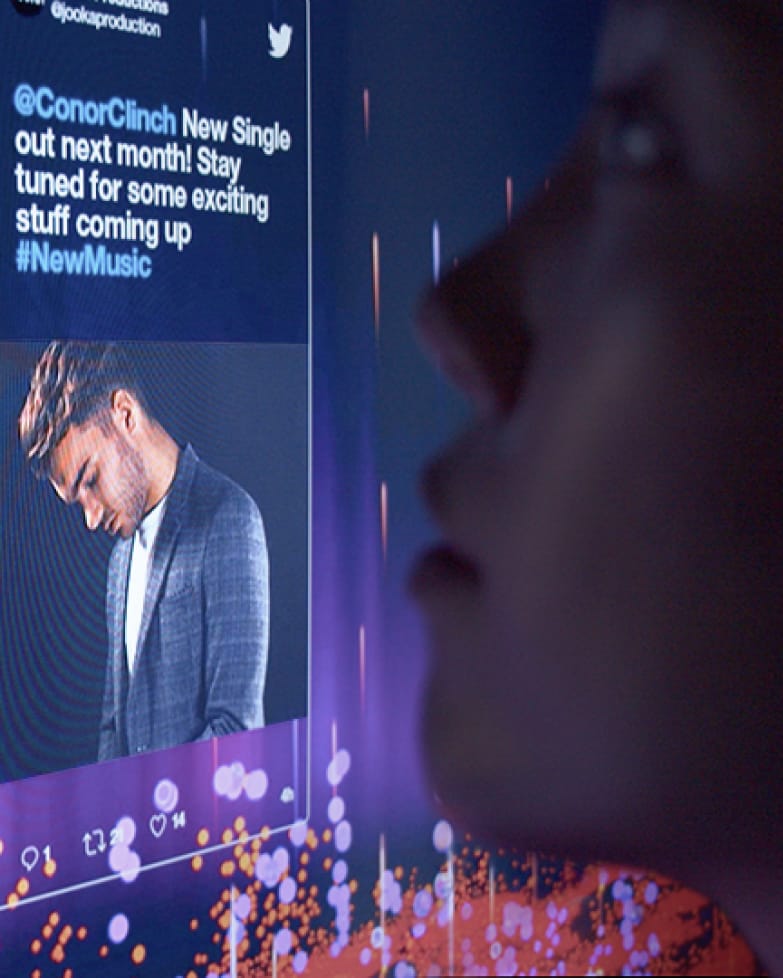
Interest Mode
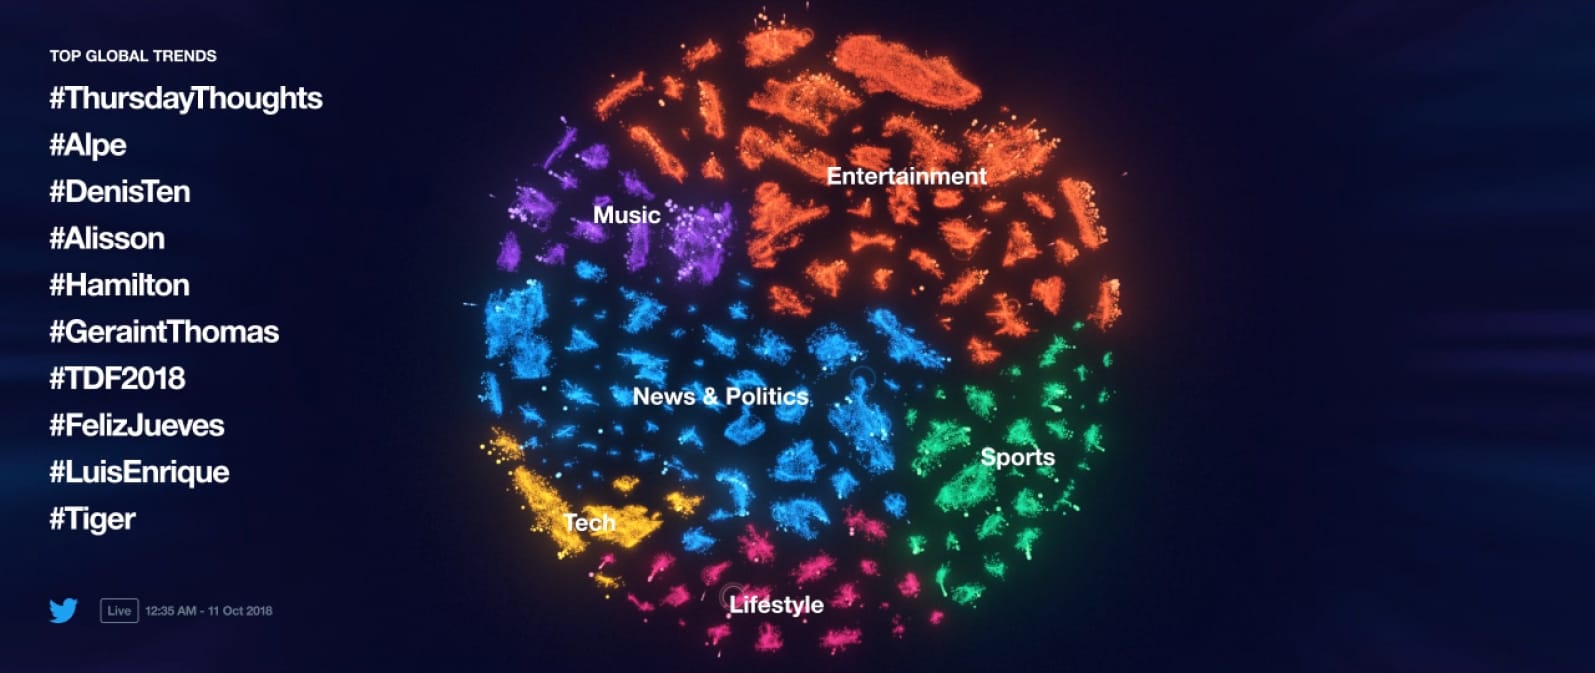
The Interest Mode groups users into communities based on commonalities. These clusters create an organizing structure that becomes a new lens into understanding the Twitter community.
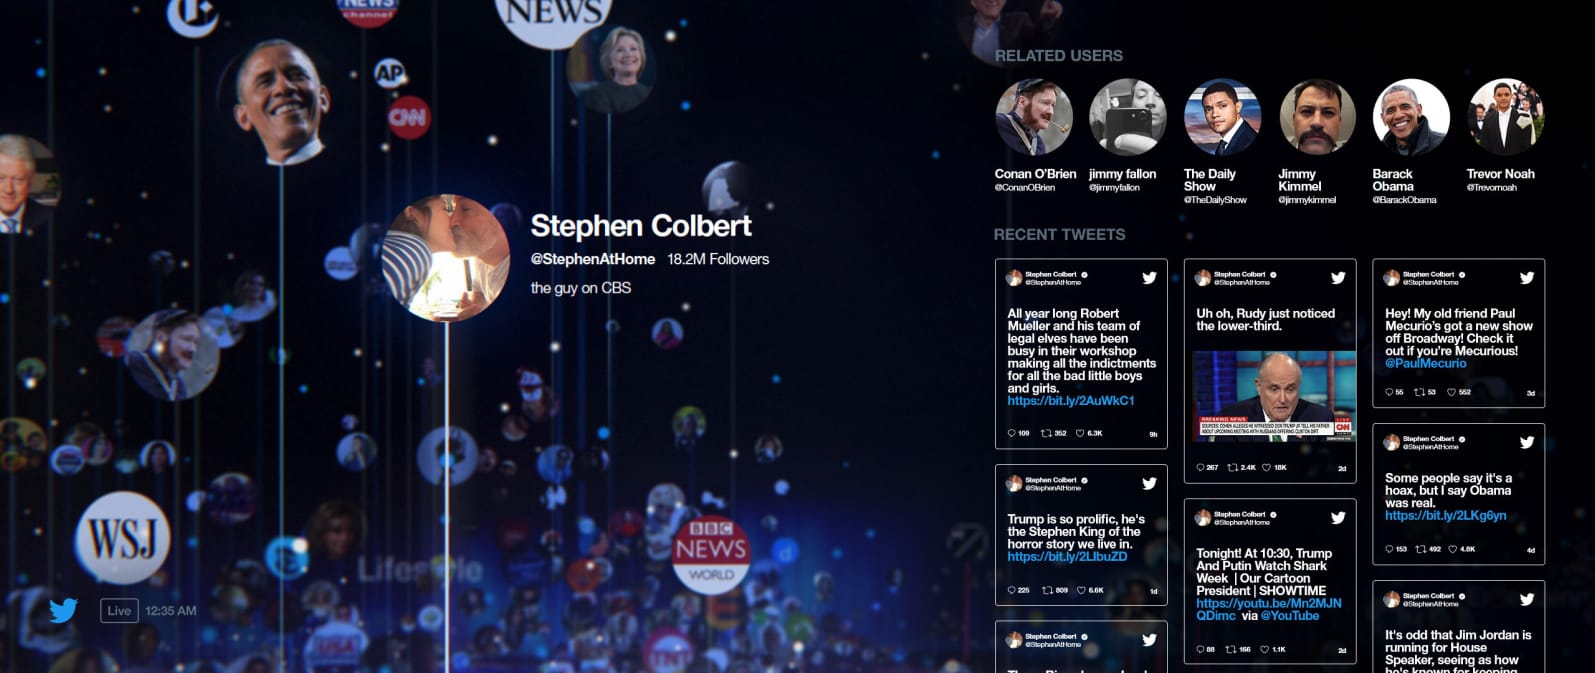
Related clusters are grouped together in 1 of 5 “continents”: News & Politics, Entertainment, Music, Sports, and Technology. For example, the K-Pop cluster is found in the Music continent. Within clusters, a user’s proximity to another user is calculated based on common followers, while a user’s follower count dictates their altitude.
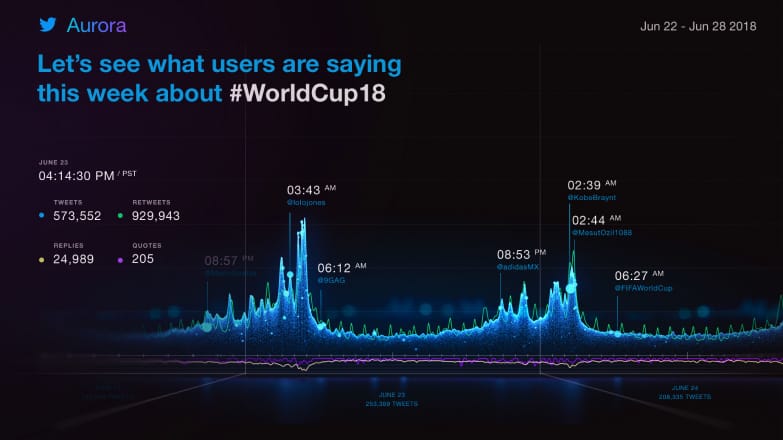
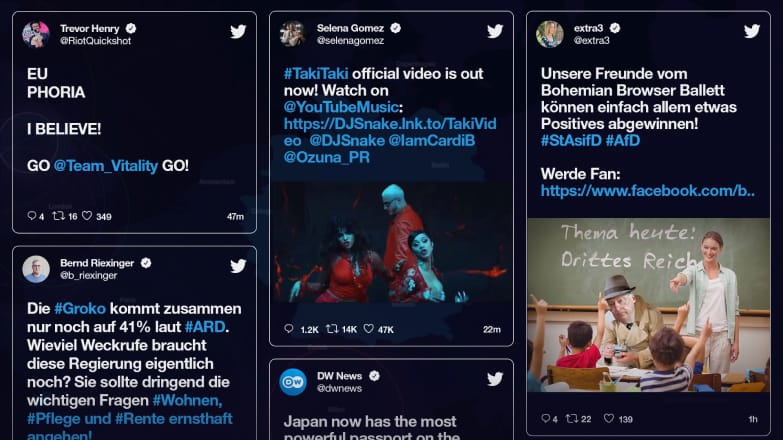
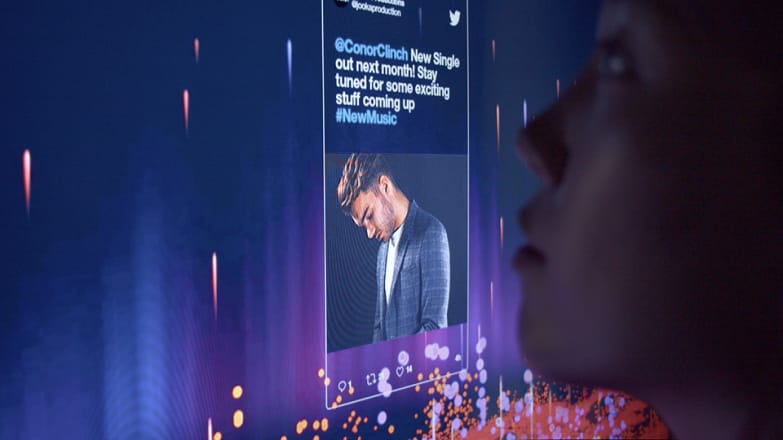
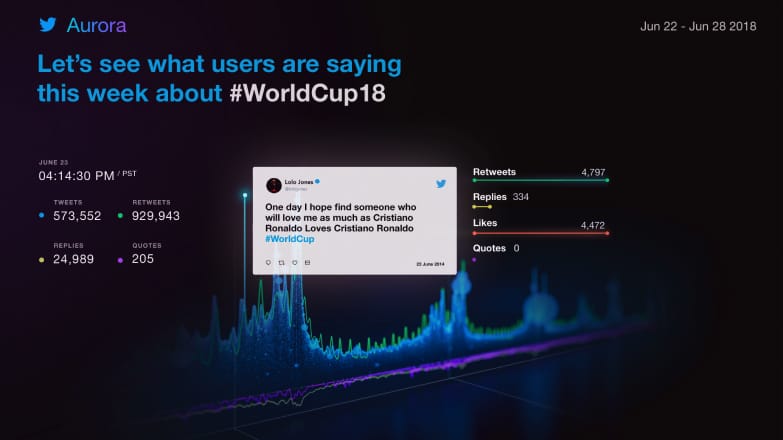
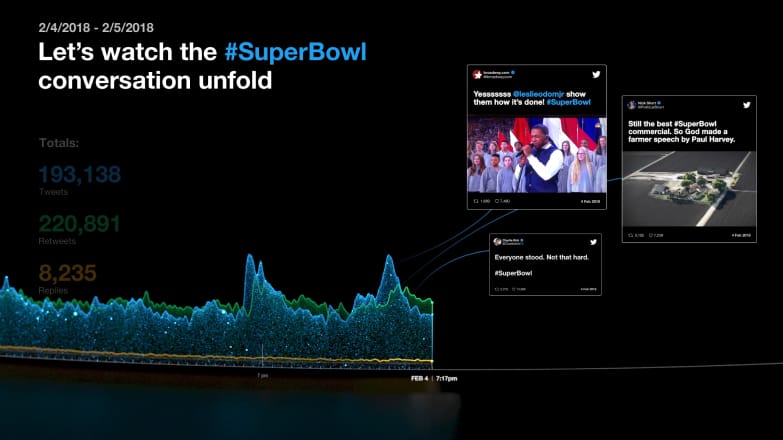
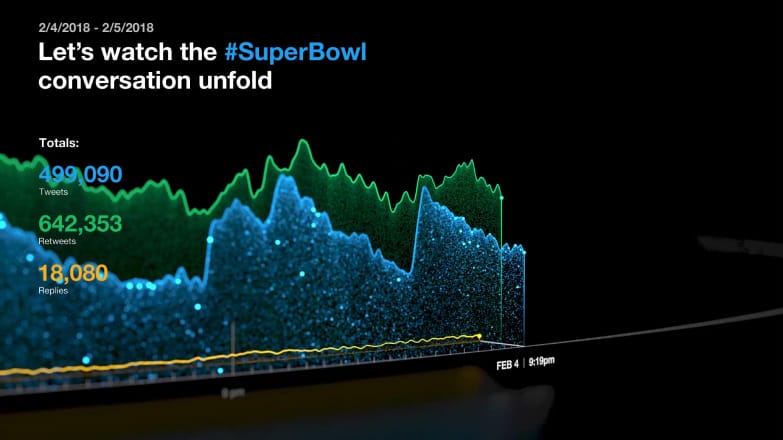
Story Mode
Story Mode exports summaries of specific events and trends into narratives. The editorial structure was designed as a tool for storytelling, sales, and presentations, further humanizing Twitter data into easily digestible and relatable insights.

Experiments and R&D


Design + Motion
Strategy
Art Direction
Visual Design
Motion Design
Interactive Design
Technology
Technical Direction
Front-end Development
New York
2 East Broadway, 5th Floor
New York, NY 10038
contact@rarevolume.com
+1 917 410 2690
Austin
11801 Domain Blvd, 3rd Floor
Austin, TX 78758